The brief study of the types of democracy and voting systems was interesting as well as threw up a couple of insights for me. Still, mulching Wikipedia is really not my favorite pastime, this is a datablog and yours truly is a data-wrangler, its time to go back to the roots. The plan in the next couple of posts is to go deeper into the consequences of the 'first past the post' voting system that India uses for its elections with the lens of data. In this post I also want to make an attempt to understand the twisted relationship between vote shares and seats won by different parties. In the process I also want to take a closer look at polygonal contests in this voting system.
There is a tendency in large parts of the media to simplify the narrative of this election. Straight contests lend easily to tv debates and montages, Congress vs. BJP, Rahul Gandhi on one side, Narendra Modi on the other and the parliament house in between. A rather simplistic picture, with undertones of a wave of voters moving from one camp to another that needs to be exploded further. The graphic below shows the vote shares and seats of the primary Parties/agglomerations over the years as also combined vote share of the two main parties- the Congress and the BJP in the last few elections.
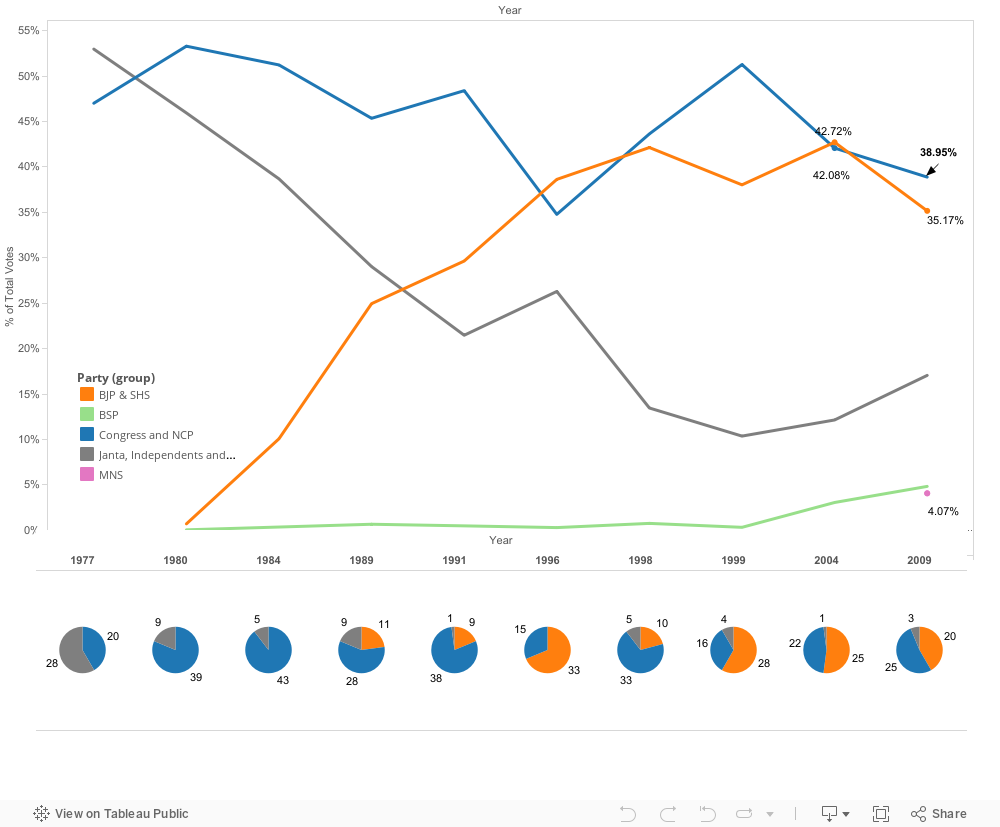
Two observations are notable here. Firstly, from (b) and (d) the strength of the two remaining national parties in terms of the votes they poll seems grossly overrated. Even if we were to add up the vote shares secured by the BJP and Congress that number often doesnt even cross 50% and if anything seems to be going down in the last couple of elections. More than half of the electorate votes for neither the BJP nor the Congress. This remaining 50% is highly fragmented among hundreds of parties (mostly regional) and this makes elections across large parts of India multi-cornered (polygonal) affairs.
Secondly from (a) and (c) the correlation between the vote shares and seats won is not straightforward. However It is well known that the first past the post voting system accentuates differences in vote share and tends to reward parties with higher vote shares disproportionately- case in point being the 1984 election when the congress with 49% vote share swept the election winning almost 80% of the seats. Again this is not all that straightforward. In the three elections between 1996 and 1999 the BJP won more seats than the congress even though it had lesser vote share nationally. A more nuanced region by region view, with an understanding of the 'polygonality' (how many corners) of the contest is needed to get to better answers and that's where I intend to go to in this post. Also there are empirical observations to correlate the the vote share and seats won - for example the the "cube law" which states that in a two cornered contest the ratio of seats won is proportional to the cube of the ratio of vote shares. I want to round up this post with a quick empirical test of the law of cubes in the Indian context.
To understand 'polygonaility' by region i.e which seats/regions in the country have straight, triangular, quadrangular and even pentagonal contest, some definitions are needed first. Given that most seats have 10 or more contestants, how do we define whether a contest is straight/triangular/quadrangular? The graphic below shows the frequency distribution of the vote share of the top 2 candidates in all seats in the 2009 election

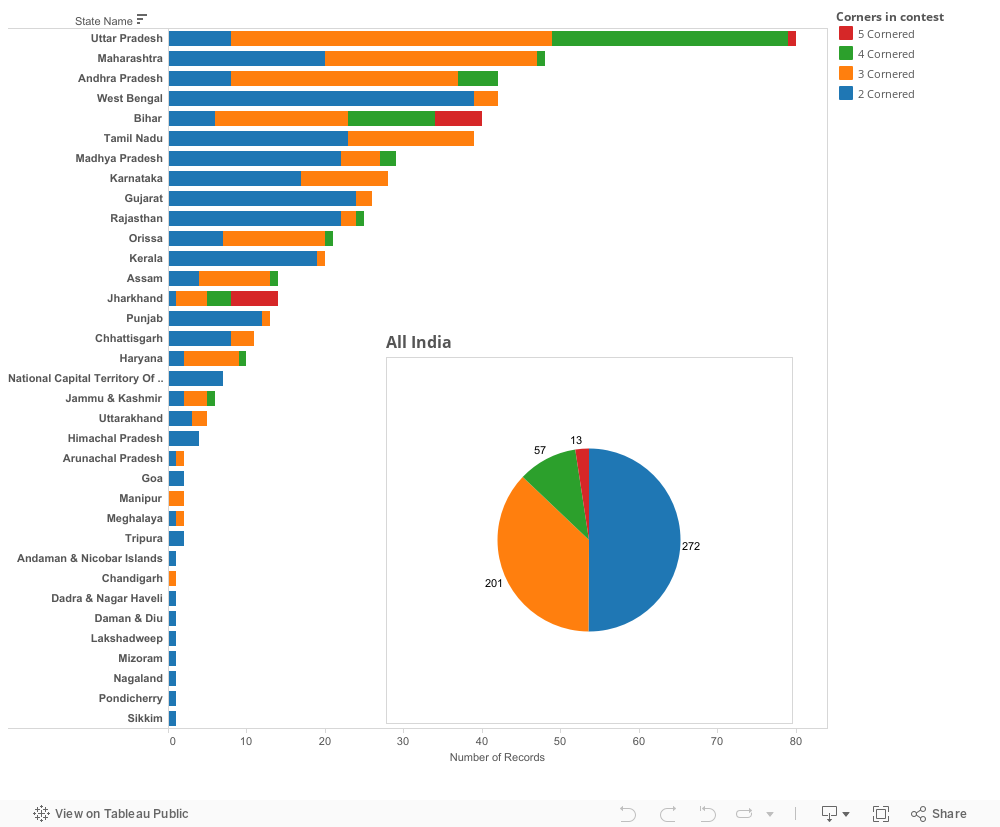
In about 22 constituencies, the top two candidates together secured between 95% to 100% of the vote share. In the context of Indian democracy this is as direct a contest as it gets. A quick look at the cumulative numbers reveals that the top two contestants together constitute more that 80% of the vote share in 272 constituencies out of the 543 (roughly half). 80% is the number I chose as the threshold for whether a contest is classified as 2 cornered, 3 cornered or 4/5 cornered. Essentially, if the top 2 make up more that 80% of the vote share it is classified as straight or 2 cornered contest. If that is not the case but the top 3 constitute more than 80% of the vote share then it is classified as a triangular or 3 cornered contest and similarly for 4 cornered (quadrilateral) and 5 cornered (pentagonal) contests.
The following graphic shows the geographical distribution constituencies based on the polygonality of the contest in 2009.
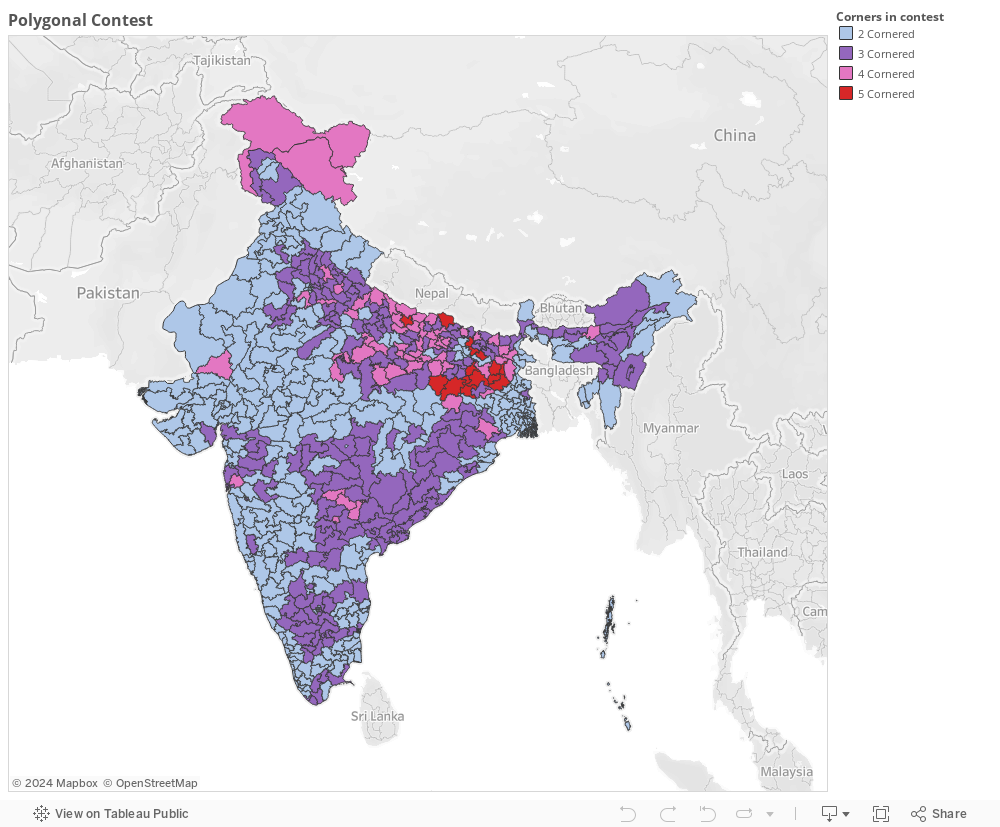
It is interesting to see that the contest is essentially 2 cornered (by the given definition) in large parts of Punjab, Himachal, Rajasthan, Madhya Pradesh, Chhattisgarh, Gujarat, Northern Karnataka, Kerala and West Bengal. Meanwhile large parts of Tamil Nadu, Andhra Pradesh, Orissa, Assam and Maharashtra witnessed three cornered contests where as other parts of UP, Bihar and Jharkhand witnessed triangular/quadrangular and in some rare cases even pentagonal contests. In Nawada, Bihar the top 4 condidates secured just 62% votes between them, with the winner getting away with merely 22% vote.
The following graphic shows different states characterized by the polygonality of the contest in its seats.
Looking at the major states one by one, in UP we find the usual suspects(BJP, BSP, SP, Congress) engaged in a 3 or 4 cornered contest in most seats. The notable exceptions to this are the usual pocket boroughs of various parties where one predominant contestant gives the appearance of a straight contest. For example Mainpuri, Etawah (SP strongholds) and Amethi, Raebareily (for INC).
In the case of Maharashtra one would be expecting it to be a straight contest between the NDA (BJP+SHS) and UPA (INC+NCP) but it is not quiet. In a large part of Vidharba the BSP among others offers a third alternative making it a triangular contest and similarly in the Urban areas of Mumbai, Pune and Nasik, the MNS was able to eat into significant vote share of the Shiv Sena to make it a 3 cornered contest.
AP sees quiet a number of 3-4 corner contests with Congress, Telegu Desam, Telangana Rashtra Samiti, Chiranjeevi's Praja Rajyam party and in a few case the BJP fighting for the spoils.
Rajasthan, Gujarat, Madhya Pradesh, Chhattisgarh, Punjab, West Bengal and Kerala witness primarily straight contests. The only nuance being that while in the case of the first 5 it is primarily between the Congress and the BJP, the latter 2 were primary between Congress vs Left/others.
In both Bihar and Jharkhand , multiple regional parties (some of whom fight elections in both the contiguous states) lead to 4 cornered and 5 cornered contests.
To wrap up I want to take a look at the applicability of the law of cubes in smaller subsets of seats, where there is a direct contest. Of the 272 seats where there seams to be a direct contest , The NDA and the UPA were locked in direct contest in only about 150 seats. The states of Gujarat, Madhya Pradesh, Maharashtra, Rajasthan, Chhattisgarh, Delhi, Punjab constituted a bulk of these seats. Of the remaining 122 direct contest seats - the UPA was competing with a regional party/Third front in 107 seats (primarily West Bengal, Kerala and Tamil Nadu), the NDA was competing with regional parties/3rd front in 8 seats and the contest was between 2 regional parties in the remaining 7. Must be said here that in West Bengal and Tamil Nadu, the UPA had significant allies in 2009 which it has since lost. The contour of elections in West Bengal will be more and more 3/4 cornered and the same would go for Tamil Nadu where the old Congress alliance with DMK no longer exists.

The graphic on the side shows a quick analysis shows that the law of cubes is only roughly applicable to even this set of constituencies where we have as close to a direct contest as possible in the Indian context. What the law can do for us is that it can give us a rough idea of what a change in vote shares would do to the number of seats won (on the 150 seats where there was a direct contest). The above calculation also illustrates the effect of a 10% change in vote share. As for trying to predict the number of seats at a national level based on a shift in vote shares (from poorly opinion polls), well thats a job better left to the professional psephologist.
There is a tendency in large parts of the media to simplify the narrative of this election. Straight contests lend easily to tv debates and montages, Congress vs. BJP, Rahul Gandhi on one side, Narendra Modi on the other and the parliament house in between. A rather simplistic picture, with undertones of a wave of voters moving from one camp to another that needs to be exploded further. The graphic below shows the vote shares and seats of the primary Parties/agglomerations over the years as also combined vote share of the two main parties- the Congress and the BJP in the last few elections.
Two observations are notable here. Firstly, from (b) and (d) the strength of the two remaining national parties in terms of the votes they poll seems grossly overrated. Even if we were to add up the vote shares secured by the BJP and Congress that number often doesnt even cross 50% and if anything seems to be going down in the last couple of elections. More than half of the electorate votes for neither the BJP nor the Congress. This remaining 50% is highly fragmented among hundreds of parties (mostly regional) and this makes elections across large parts of India multi-cornered (polygonal) affairs.
Secondly from (a) and (c) the correlation between the vote shares and seats won is not straightforward. However It is well known that the first past the post voting system accentuates differences in vote share and tends to reward parties with higher vote shares disproportionately- case in point being the 1984 election when the congress with 49% vote share swept the election winning almost 80% of the seats. Again this is not all that straightforward. In the three elections between 1996 and 1999 the BJP won more seats than the congress even though it had lesser vote share nationally. A more nuanced region by region view, with an understanding of the 'polygonality' (how many corners) of the contest is needed to get to better answers and that's where I intend to go to in this post. Also there are empirical observations to correlate the the vote share and seats won - for example the the "cube law" which states that in a two cornered contest the ratio of seats won is proportional to the cube of the ratio of vote shares. I want to round up this post with a quick empirical test of the law of cubes in the Indian context.
To understand 'polygonaility' by region i.e which seats/regions in the country have straight, triangular, quadrangular and even pentagonal contest, some definitions are needed first. Given that most seats have 10 or more contestants, how do we define whether a contest is straight/triangular/quadrangular? The graphic below shows the frequency distribution of the vote share of the top 2 candidates in all seats in the 2009 election
In about 22 constituencies, the top two candidates together secured between 95% to 100% of the vote share. In the context of Indian democracy this is as direct a contest as it gets. A quick look at the cumulative numbers reveals that the top two contestants together constitute more that 80% of the vote share in 272 constituencies out of the 543 (roughly half). 80% is the number I chose as the threshold for whether a contest is classified as 2 cornered, 3 cornered or 4/5 cornered. Essentially, if the top 2 make up more that 80% of the vote share it is classified as straight or 2 cornered contest. If that is not the case but the top 3 constitute more than 80% of the vote share then it is classified as a triangular or 3 cornered contest and similarly for 4 cornered (quadrilateral) and 5 cornered (pentagonal) contests.
The following graphic shows the geographical distribution constituencies based on the polygonality of the contest in 2009.
It is interesting to see that the contest is essentially 2 cornered (by the given definition) in large parts of Punjab, Himachal, Rajasthan, Madhya Pradesh, Chhattisgarh, Gujarat, Northern Karnataka, Kerala and West Bengal. Meanwhile large parts of Tamil Nadu, Andhra Pradesh, Orissa, Assam and Maharashtra witnessed three cornered contests where as other parts of UP, Bihar and Jharkhand witnessed triangular/quadrangular and in some rare cases even pentagonal contests. In Nawada, Bihar the top 4 condidates secured just 62% votes between them, with the winner getting away with merely 22% vote.
The following graphic shows different states characterized by the polygonality of the contest in its seats.
Looking at the major states one by one, in UP we find the usual suspects(BJP, BSP, SP, Congress) engaged in a 3 or 4 cornered contest in most seats. The notable exceptions to this are the usual pocket boroughs of various parties where one predominant contestant gives the appearance of a straight contest. For example Mainpuri, Etawah (SP strongholds) and Amethi, Raebareily (for INC).
In the case of Maharashtra one would be expecting it to be a straight contest between the NDA (BJP+SHS) and UPA (INC+NCP) but it is not quiet. In a large part of Vidharba the BSP among others offers a third alternative making it a triangular contest and similarly in the Urban areas of Mumbai, Pune and Nasik, the MNS was able to eat into significant vote share of the Shiv Sena to make it a 3 cornered contest.
AP sees quiet a number of 3-4 corner contests with Congress, Telegu Desam, Telangana Rashtra Samiti, Chiranjeevi's Praja Rajyam party and in a few case the BJP fighting for the spoils.
Rajasthan, Gujarat, Madhya Pradesh, Chhattisgarh, Punjab, West Bengal and Kerala witness primarily straight contests. The only nuance being that while in the case of the first 5 it is primarily between the Congress and the BJP, the latter 2 were primary between Congress vs Left/others.
In both Bihar and Jharkhand , multiple regional parties (some of whom fight elections in both the contiguous states) lead to 4 cornered and 5 cornered contests.
To wrap up I want to take a look at the applicability of the law of cubes in smaller subsets of seats, where there is a direct contest. Of the 272 seats where there seams to be a direct contest , The NDA and the UPA were locked in direct contest in only about 150 seats. The states of Gujarat, Madhya Pradesh, Maharashtra, Rajasthan, Chhattisgarh, Delhi, Punjab constituted a bulk of these seats. Of the remaining 122 direct contest seats - the UPA was competing with a regional party/Third front in 107 seats (primarily West Bengal, Kerala and Tamil Nadu), the NDA was competing with regional parties/3rd front in 8 seats and the contest was between 2 regional parties in the remaining 7. Must be said here that in West Bengal and Tamil Nadu, the UPA had significant allies in 2009 which it has since lost. The contour of elections in West Bengal will be more and more 3/4 cornered and the same would go for Tamil Nadu where the old Congress alliance with DMK no longer exists.
The graphic on the side shows a quick analysis shows that the law of cubes is only roughly applicable to even this set of constituencies where we have as close to a direct contest as possible in the Indian context. What the law can do for us is that it can give us a rough idea of what a change in vote shares would do to the number of seats won (on the 150 seats where there was a direct contest). The above calculation also illustrates the effect of a 10% change in vote share. As for trying to predict the number of seats at a national level based on a shift in vote shares (from poorly opinion polls), well thats a job better left to the professional psephologist.
No comments:
Post a Comment